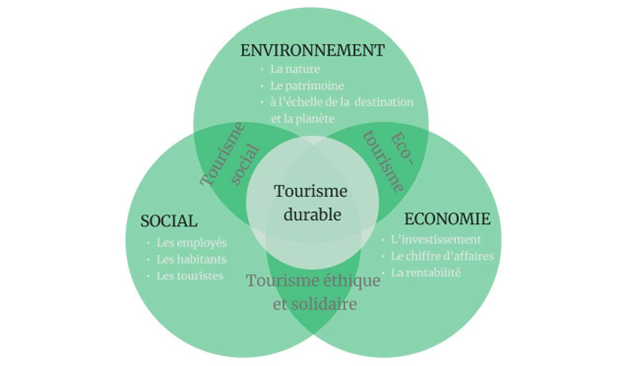
Sustainable tourism is defined by the World Tourism Organization (UNWTO) as “tourism that takes full account of its current and future economic, social and environmental impacts, addressing the needs of visitors, the industry, the environment and host communities“. It aims to achieve a balance between the three pillars of sustainable development in the production and implementation of tourism activities.

Figure 1 - The three pillars of sustainable tourism (Atout France)
Sustainable tourism is also the responsibility of individual travelers. They can take action by paying attention to their travel behavior (waste sorting, respect for protected areas, responsible water use, etc.) and their choice of tourism operators or destinations, according to sustainability criteria.
The Flockeo map displays environmental indicators of sustainable tourism developed by engineers at our parent company Murmuration. The main indicator is TSDI (Tourism Sustainable Development Index). Developed from Earth observation data and socio-economic data,TSDI aims to evaluate the evolution of destinations in terms of sustainable tourism, and thus to highlight the most sustainable countries.
TSDI is calculated by dividing the Human and Tourism indicator with an Environmental Risk indicator.
Simplified formula:
Human development and Tourism component: States are evaluated on Human indicators, such as the health and education levels of their inhabitants, as well as the country’s economic power. States are also evaluated on UNWTO data concerning tourist arrivals and revenues per country and per year. The higher the Human Development and Tourism indicator, the better the country’s development.
Environmental Risk component: TSDI highlights countries that comply with the World Health Organization’s environmental standards for air quality. It also recognizes countries that are reforesting or preserving forest areas on their territory, as well as those with low water-related risks (water stress, flood risk, drinking water, etc.) and that are meeting their commitments to reduce net CO2eq emissions by 2030.
Flockeo travel highlights the balance between human, tourism and environmental development. Tourism and/or human pressure have an impact on the environmental score and therefore on TSDI score.
Thus, the higher the Environmental Risk, the lower the “Human and Tourism indicator” (it can be divided by up to 4), and therefore the worse TSDI.
Conversely, if the Environmental Risk is low, then the “Human and Tourism indicator” will not be reduced (it may even be enhanced), and so, TSDI score will be high.
Flockeo Travel
This map shows TSDI. It combines all the sub-indicators into a single index to provide at a glance an overview of countries that value human and tourism development while preserving ecosystems and human health.
Eco-friendly travel
The eco-friendly travel map provides an overall view of the Environmental Risk component. It is calculated from the following sub-indicators:
Air quality is assessed according to two timeframes: a yearly score and a seasonal score. To obtain a good score above the average, the World Health Organization (WHO) pollution thresholds must be respected 90% of the time.
The Water Resources score is based on an aggregate indicator derived from the work of the World Research Institute (Aqueduct platform). It includes more than fifteen indicators, such as water stress and flood risk.
This sub-indicator indicates the preservation of forest cover over the last 20 years. An area that has preserved or increased its forest cover over this period will be rated highly. On the other hand, an area that has deforested will score poorly.
A fourth sub-indicator has been added to compare carbon emissions linked to national consumption (Global Carbon Atlas) with the government directives put in place as part of the Paris Agreement on Climate Change (Distributed National Contributions).
Ethical travel
The ethical travel base map gives an overall view of the Human Development and Tourism component. It is calculated from the following sub-indicators:
Health is assessed by comparing the life expectancy of inhabitants with the highest and lowest life expectancy recorded among the countries of the world over the current period. The data comes from INSEE.
Education is a strong indicator of a country’s development. Access to schooling for boys and girls plays a key role in the Human development indicator. This aspect is integrated into the Human development component by taking into account the level of education of the current adult population and life expectancy at school, from kindergarten to higher education. The data comes from Unesco.
GDP per capita
GDP per capita allows us to include the economic dimension of human development. However, the aim of TSDI is not to reward the richest countries, but those that strike the right balance between human development and sustainable development. A threshold is therefore set, above which the country is not rated any higher. Data provided by the International Monetary Fund.
Tourism attractiveness
This indicator provides information on the volume of tourists per year (domestic and international). The total number of trips is divided by the country’s population to obtain a number of tourists per inhabitant. Data provided by UNWTO.
Tourism income
This indicator shows the amount of tourism income generated in a country. A threshold is set at 10 billion dollars, beyond which countries that exceed it have the highest possible score and are not further valued. Data supplied by UNWTO.
Murmuration: Murmuration
Air Quality: CAMS global atmospheric composition forecasts
Water Quality: Aqueduct Water Risk Atlas
Forest Policy: MODIS de Google Earth Engine
CO2 emissions compared with the Paris Agreement’s Nationally Determined Contributions: Global Carbon Atlas, NDC database
Life expectancy: Insee
Education: UNESCO
GDP per capita: IMF
Tourism attractiveness and income: OMT